Section 1.1
Interval notation and set-builder notation:
-What are the differences between interval notation and set-builder notation?
Interval Notation appears as an ordered pair.
Examples: (5, 19), [4, 7], (-∞, 4), (-∞, 10], (9, ∞), [11, ∞)
-What do the different parenthesis mean?
When given a problem with an equation that has a < or > symbol, because it
is not equal to the actual numbers being represented we want to use regular,
or curved parenthesis.
Example: (6, 21)
When given a problem with an equation that has a ≤ or ≥ symbol, because it
is equal to the numbers being represented we want to use the squared parenthesis.
Example: [3, 14]
-What do the different infinity signs represent?
The negative infinity sign represents the never ending continuation of all numbers below zero.
The positive infinity sign represents the never ending continuation of all numbers above zero.
When we write an ordered pair with an infinity sign, regardless of it's less than of equal to,
or greater than or equal to, we want to use a curved parenthesis, since infinity is not a defined number.
Example: [4, ∞)
**That is the only time that you will have a curved, and a square parenthesis on the same
interval notation.**
When given a problem that has more than one inequalities it will be in union with the other.
Example: x < 3 or x > 54 or it can also be written as 3 > x > 54. Answer: (-∞, 3) U (54, ∞)
Set-Builder Notation appears to be a little more complicated than an ordered pair.
Example: Using set-builder notation, describe x > 17. Answer: {x| x > 17, x E R}
-What does "{x|" stand for?
When we read set-builder out loud, the "{x|" in every set-builder will appear just the same
and it reads as "x, such that..."
-Where did the next part, "x > 17" come from?
We want to take the equation we are describing and put it after the "{x|" in our set-builder.
-Where did the final part, "x E R}" come from?
"x E R" reads as "x is an element of all real numbers." In every set-builder notation that you do you
will always have x, or whatever variable you are using, as an element of something.
The things the x can be an element are: Q, I, Z, W, N, or , which stand for (in order)
rationales, irrationals, integers, wholes, naturals, and real numbers.
Other ways you make be asked to describe a set of numbers in set-builder:
Example: {6, 7, 8, 9, 10...} Answer: {x| x ≥ 6, x E N}
-How do interval notation and set-builder notation tie into one another?
Example: Describe x > 2 using interval notation and set-builder notation.
Answers: Interval- (2, ∞)
Set-Builder- {x| x > 2, x E R}
Identifying functions:
-What is a vertical line test?
When identifying a function there should never be two x values with two different y values.
The vertical line test is a test when given a graph you should be able to draw a vertical line through
any point and it will not touch your graph at more than one point.
Example:
When identifying a function there should never be two x values with two different y values.
The vertical line test is a test when given a graph you should be able to draw a vertical line through
any point and it will not touch your graph at more than one point.
Example:

Because the vertical line passes through more than one
point on the graph, it is not considered a function.
-How do we identify functions from the equations?
When given an equation we wan to make sure that for every one y in the equation we only
get one x as well.
Example: y=x is a function as is y=x², but there cannot be more than one y,
or it will no longer be a function (x=y²).
-How do we identify functions from the x, y chart?
Depending on the problem, it is possible to have more than one x, both with the same
y values, but we never want to have two x's with different y values.
Example: X Values Y Values
2 3 This would not represent a
4 5 function because there are
4 6 two x values with different
7 9 y values.
9 11
Determining the domain
-How do we determine the domain of an equation?
The domain is your x value. When solving for it there are several different ways
that it may be presented to you.
Example: √4x-1 Because we have a square root we want to set what's
underneath it ≥ to zero.
So...4x-1 ≥ 0
x ≥ 1/4
**Relating it back to interval notation we can also write it as [1/4, ∞).**
Example: f(x)=3x²/x²-1 Because we have a denominator, we want to
take it and set it equal to zero.
So...x²-1=0
(x-1)(x+1)=0
x=1, -1
**Relating it back to set-builder notation whatever we get for our answers here
will not be numbers that we could use as an x value. So if this was written in
set-builder notation it would be written as {x| x ≠ 1, x ≠ -1, x E R}.**

Evaluating piecewise functions
Piecewise functions will appear as shown above.
You will be given a value to solve for; in this case we will be solving for -1.
First we want to look at all of the inequalities in our piecewise and plug -1 in for x.
Whatever inequality solves to be true has the corresponding equation that we want
to solve for. In this case, -1 fits into the first inequality listed, so we want to plug that
into the equation so (-1+4)²-2
(3)²-2 We end up with 11
9-2 as our answer.
11
Section 1.5
TRANSFORMATIONS
There are several different kinds of transformations.
The first would be a transformation upwards.
The first would be a transformation upwards.
In the graph above the original equation is in blue, and the new, transformed one
is in red. The reason why the graph is transformed up would be because there is
+1 after the x².
It would be the same way if there was any other number greater than zero added
after the x².
is in red. The reason why the graph is transformed up would be because there is
+1 after the x².
It would be the same way if there was any other number greater than zero added
after the x².
In the graph above the original equation is in red, and the new, transformed one
is in the green. The reason why the graph is transformed down would be because
there is the -5 after 2x².
It would be the same way if there was another other number below zero subtracted
after the x².
is in the green. The reason why the graph is transformed down would be because
there is the -5 after 2x².
It would be the same way if there was another other number below zero subtracted
after the x².
In the graph above the original equation is in red, and the new, transformed one is
in blue. The reason why the graph is transformed to the left is because inside of the
parenthesis there is a number being added to the x.
in blue. The reason why the graph is transformed to the left is because inside of the
parenthesis there is a number being added to the x.
In the graph above the original equation is in the red, and the new, transformed one
is in blue. The reason why the graph is transformed to the right it because inside of
the parenthesis there is a number being subtracted from the x.
is in blue. The reason why the graph is transformed to the right it because inside of
the parenthesis there is a number being subtracted from the x.
In the graph above the original equation is in the red, and the new, transformed one
is in green. The reason why the graph is reflected over the x-axis is because the x is
negative in the equation.
is in green. The reason why the graph is reflected over the x-axis is because the x is
negative in the equation.
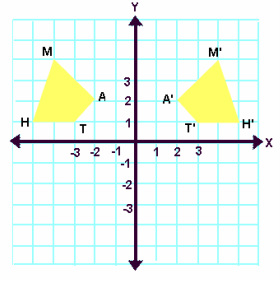
In the graph above the shape is reflected over the y-axis. When something is reflected
over the y-axis, the new equation will have a negative inside of the parenthesis, in
front of the x.
over the y-axis, the new equation will have a negative inside of the parenthesis, in
front of the x.
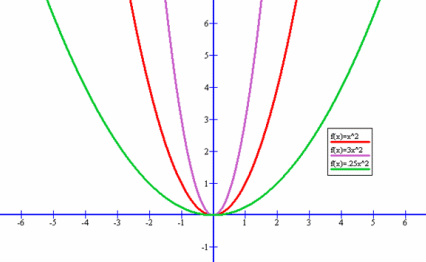
Vertical stretches and compressions are shown above. The original graph is in red.
A vertical stretch is shown in the green because the number in front of the x is less
than one, but greater than zero.
A vertical compression is shown in purple because the number in front of the x is
greater than one.
A vertical stretch is shown in the green because the number in front of the x is less
than one, but greater than zero.
A vertical compression is shown in purple because the number in front of the x is
greater than one.
Horizontal stretches and compressions are shown above. The original graph is in
purple.
A horizontal stretch is shown in the blue because the number inside the parenthesis
with the x is greater than zero, but less than one.
A horizontal compression is shown in red because the number inside the parenthesis
is greater than one.
purple.
A horizontal stretch is shown in the blue because the number inside the parenthesis
with the x is greater than zero, but less than one.
A horizontal compression is shown in red because the number inside the parenthesis
is greater than one.
GRAPHING PIECEWISE FUNCTIONS
We already went over how to solve piecewise functions in section 1.1, but now we want to graph them.
Below is a picture of a piecewise graph with two functions on it. Typically, piecewise graphs have two
or more lines on it, but the most common is three.
Below is a picture of a piecewise graph with two functions on it. Typically, piecewise graphs have two
or more lines on it, but the most common is three.
When given a piecewise function to graph, we want to look at the inequalities first. Whatever
numbers are present in the inequality are the numbers we want to look at. We want to take
that number and plug it in for the x in our corresponding equation. After we do that we will
solve for the y. The x and the y will represent your first coordinate on that line and so when
you plot it, at that coordinate you want to use a closed circle if your inequality has a less than
or equal to sign or a greater than or equal to sign. You want to use an open circle if your
inequality has a less than sign or a greater than sign. After finding your first point you want to
find numbers that are less than or greater than your first x depending on what symbol you
have. After doing that you want to solve for y and then plot. You do the same process for all
of the equations you have in your piecewise. If you ever have two numbers you want to solve
for the number that comes first, and then find what direction or shape the graph is and then
you want to do the same for the second, but keep in mind the first (x, y) for your first number
in the inequality, and the second (x, y) for your second number in the inequality will be the
beginning and the end of that graph; it does not continue on.
Section 1.6
OPERATIONS WITH FUNCTIONS
Sum: (f+g)x=f(x)+g(x)
Difference: (f-g)x=f(x)-g(x)
Product: (f•g)x=f(x)•g(x)
Quotient: (f/g)x=f(x)/g(x)
Example: given that f(x)=x^2+4x, g(x)=x+2
now find the sum, difference, product, and quotients of them.
What you do is you take what each one equals and plug it into the different equations then solve.
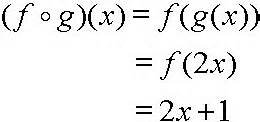
Next we move into composition of functions which will look like this: (fog)x or f o g
what you do for these is you take the different equations you are given and in this one in particular we will take the f(x) function and for every x that there is in the g(x) function we will plug in f(x) and solve.
Difference: (f-g)x=f(x)-g(x)
Product: (f•g)x=f(x)•g(x)
Quotient: (f/g)x=f(x)/g(x)
Example: given that f(x)=x^2+4x, g(x)=x+2
now find the sum, difference, product, and quotients of them.
What you do is you take what each one equals and plug it into the different equations then solve.
Next we move into composition of functions which will look like this: (fog)x or f o g
what you do for these is you take the different equations you are given and in this one in particular we will take the f(x) function and for every x that there is in the g(x) function we will plug in f(x) and solve.
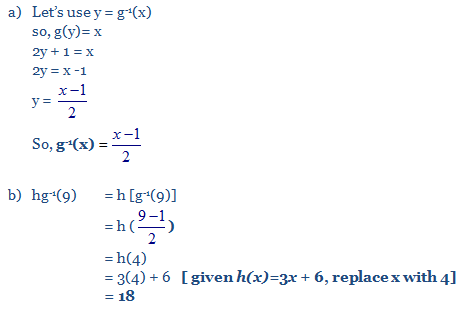
Section 1.7
We have this thing called the horizontal line test and for any graph you are looking at you can draw a straight horizontal line to tell if the graph shows a function or not.
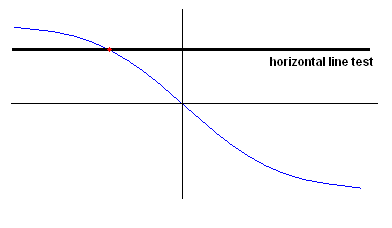
we also have to see if functions have inverses or not by first doing the horizontal line test then plugging f-1 in for f in functions.
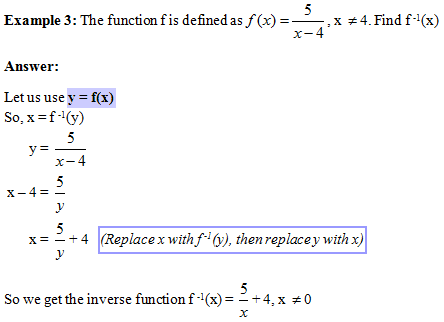
we also covered composites of inverse functions which is where you have to show that f(x) and g(x) are inverses.
Section 2.2
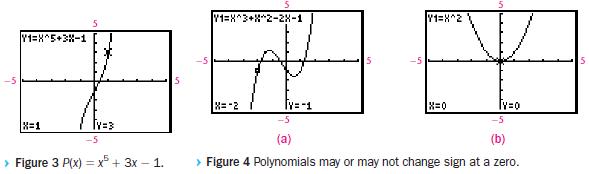
Polynomial and monomial functions and the leading term test. if the leading term is odd the graph will go in different directions, if it is positive it will go down on the left side and up on the right, if it is negative it will do the opposite. if it is even and positive it will go up on both ends and if it is negative it will go down.
Zeroes and turning points:
zeroes are the number of times that the graph will cross the x-axis and turning points are the number of times the graph has changed direction.
Example: 3x^6 has a possible number of 6 zeroes and five turning points. reason being is because 6 is the leading exponent in the equation and so that number is the number of possible zeroes, and then that number -1 is the number of possible turning points.
Section 2.4
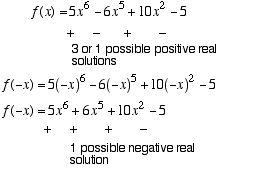
Zeros of Polynomial functions:
Descartes Rule of Signs states that the number of positive real zeroes is equal to or less than the number of variations in the function from positive to negative.
Descartes Rule of Signs states that the number of positive real zeroes is equal to or less than the number of variations in the function from positive to negative.